Operational Performance

High Performance

Scroll to read
Geek+, Goodman Kunshan North Park, Greater Shanghai, China

The Group has delivered another strong operating performance in FY19 as customers continue to demand proximity to consumers. This is due to the fundamental strength of our $46 billion portfolio, and our development and management businesses, which have been positioned to take advantage of the structural changes we are seeing around the world.

  • $46.2bn

    Total assets under
    management

    + 21% on FY18

  • 383

    Properties in key
    urban locations

  • 1600+

    Customers

  •  
  •  
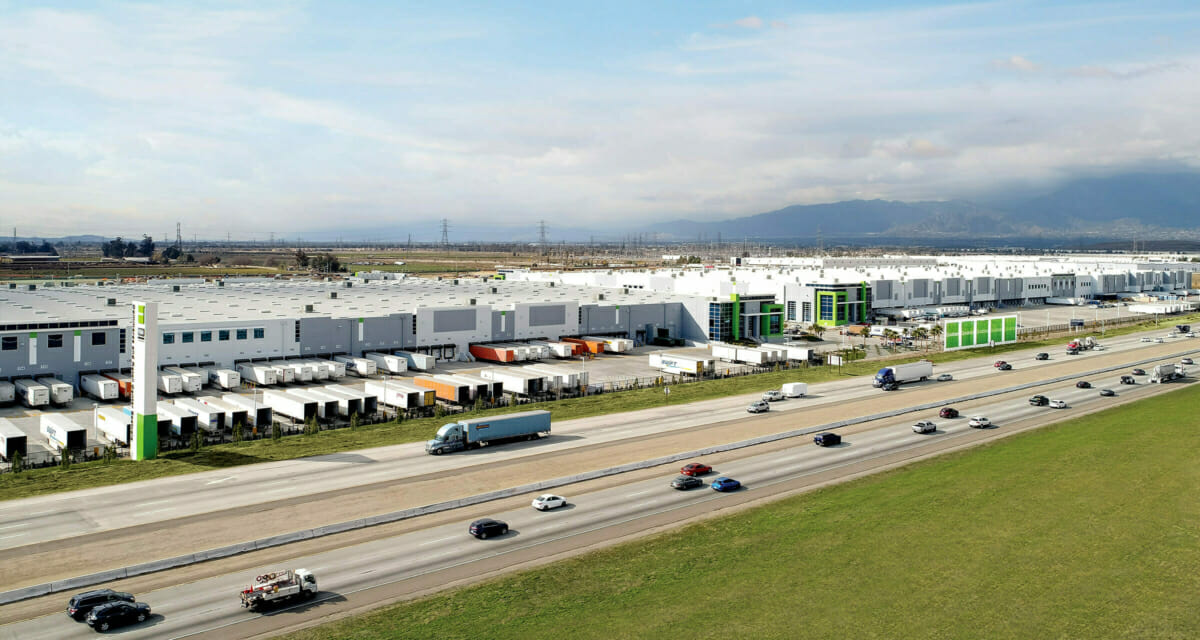
Goodman Commerce and Retail Center Eastvale, Los Angeles, USA.

Own

Goodman Commerce Center Eastvale, Los Angeles, USA.

Portfolio concentration in infill markets is delivering strong returns

At Goodman, we use our local market knowledge to source quality locations so that our customers can be close to their customers. The location and quality of our portfolio in key urban centres has continued to drive underlying returns, resulting in high occupancy and rental growth.

The supply constraints in these markets are contributing to the strong underlying fundamentals which are driving future growth.

Top 20 global customers

(by net income – look through basis).

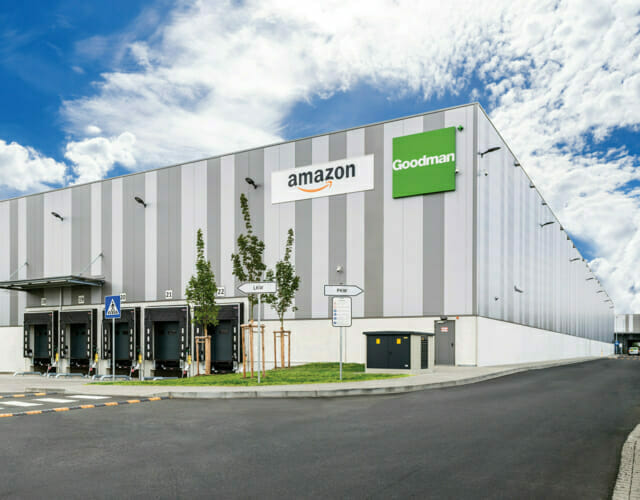
  • 5.1Amazon
  • 2.5Deutsche Post (DHL)
  • 1.9A.P. Moller – Maersk
  • 1.7Japan Post (Toll)
  • 1.6DB Schenke
  • 1.2Iron Mountain
  • 1.1Georgia Pacific
  • 1.0Coles Group
  • 1.0Kuehne + Nagel
  • 1.0JD.com
  • 0.9Equinix
  • 0.8BMW Group
  • 0.8Zalando SE
  • 0.7SF Express
  • 0.7syncreon
  • 0.7Walmart
  • 0.7IVE Group
  • 0.7Mainfreight
  • 0.7Coca-Cola Amatil
  • 0.6Metcash

Key property investment highlights include:

  • 3.4 million sqm leased equating to $478 million of annual property income
  • Portfolio occupancy maintained at 98%
  • Weighted average lease expiry (WALE) of 4.7 years
  • Like-for-like net property income growth of 3.3%*.
    * Excludes on balance sheet assets

We have a diverse range of global and local customers across industries including e-commerce, logistics, retail, automotive, pharmaceutical and technology.

Cologne II Logistics Centre, Cologne, Germany.
Develop

Develop

Structural demand expected to drive
growth in WIP to
around $5 billion in
the near term

Work in progress as at 30 June 2019

Asia 39%
Europe 25%
The Americas
20%
Australia/NZ 16%

Increased customer demand, driven by structural changes in our markets, is giving us greater confidence to escalate development activity. As a result, our development workbook is growing strongly. Commencements have increased to $4.2 billion while work in progress has increased 14% to $4.1 billion across 55 projects in 13 countries. This is expected to reach approximately $5 billion in the next 12 months.

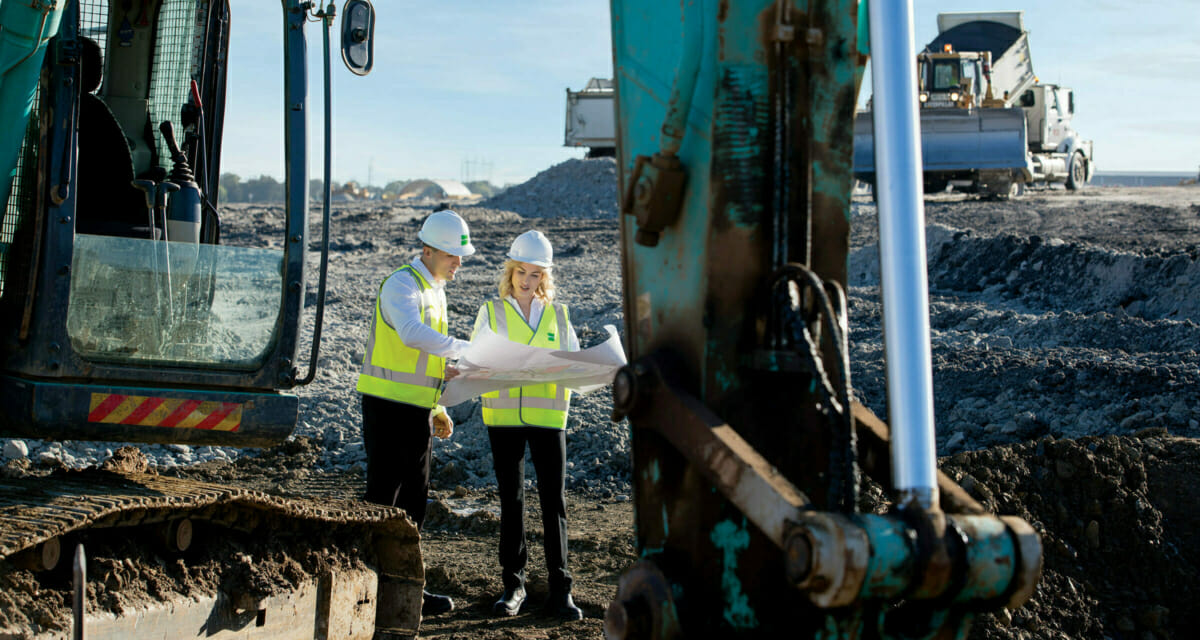
The concentration on urban logistics developments is changing the nature of our projects. Land scarcity is driving the need for multi-storey developments, automation and robotics require higher-quality facilities, while there is an ever-increasing need to integrate sustainability features into the building. We are building properties that are flexible and adaptable to accommodate the demands of the future. These projects are more complex, however, we have the skills, infrastructure and financial resources to deliver.

Other key development highlights include:

  • Development completions of $3.9 billion
  • 81% committed on completion
  • 80% of WIP undertaken within Partnerships.
Manage

Manage

Strong performance of the Partnerships and AUM growth is increasing earnings

Assets under management

  • 25.2FY15
  • 30.3
  • 29.3FY16
  • 34.1
  • 30.5FY17
  • 34.6
  • 35.1FY18
  • 38.3
  • 42.9FY19
  • 46.2

Development completions and revaluation gains led to 22% growth in external assets under management to $43 billion. The Group delivered an average total return of 16% across the Partnerships for FY19 and 16.4% p.a. over the last five years.

We raised and deployed more capital in Partnerships to fund the growth in development work, with $900 million invested by the Group over the year.

Other key management highlights include:

  • Management earnings up 48% on FY18
  • Global weighted average cap rate (WACR) tightening to 5.1%
  • $13.6 billion in equity commitments and available liquidity.